Pierce Transit Proposition 1 Approved by Voters
On Tuesday, November 3rd, 2026, Pierce Transit Proposition 1 secured enough votes to pass. As of vote counting on Friday, November 6th, it had garnered 57.8 percent of the votes cast, 103,924 yes to 75,804 no. Proposition 1 was previously covered here for its potential to transform how Pierce County moves.
The measure adds three cents to a ten dollar purchase. That takes Pierce Transit’s share of the local sales tax from 0.6 percent to 0.9 percent. Pierce Transit states that the new funding will support a 47 percent increase in service, free fares for seniors and youth, and more frequent buses on the busiest routes.
About 199,000 ballots were cast in these precincts, roughly half of the registered voters who live in them. That is typical turnout for a general election, and is close to the vote count from the failed ballot measure in 2012.
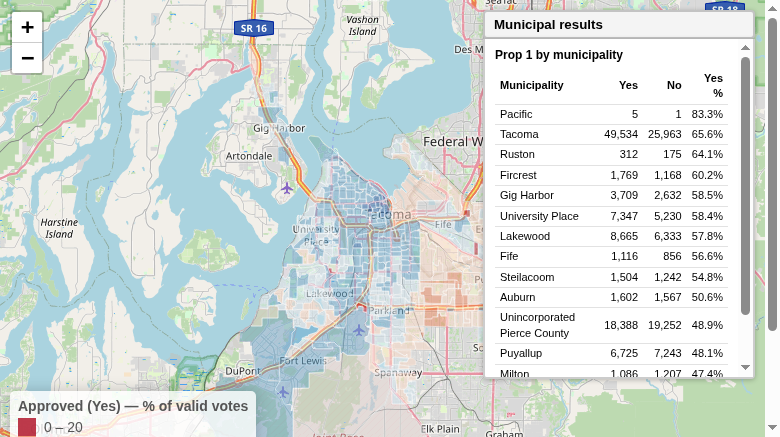
The map below shows the share of votes for and against Proposition 1 in each of the 423 precincts inside the Pierce Transit boundary. Clicking on a precinct shows its raw counts. The button in the top right opens a table of results by city.
Colors run from red for no to blue for yes, with near white for roughly 50 percent. Gray precincts recorded no ballots on the question.
The shape of transit support in Pierce County
Support for Proposition 1 was not spread evenly. It is concentrated in Tacoma and its ring of suburbs, and it tends to fall away as you move east. Some of the highest vote concentrations in favor were near Downtown Tacoma and neighborhoods like Hilltop, 6th Avenue, and the North Slope - which registered voter approval greater than 80% in some precincts (and nearly 90% in one).
The bluest parts of the Pierce Transit District tend to be the ones with the most dense housing, the most households without a car, and the most existing bus service.
Tacoma supplied the largest share of yes votes by far, at 65.6 percent. Fircrest, Gig Harbor, University Place, Lakewood, Fife and Steilacoom all cleared 54 percent. Auburn, which sits partly inside the district, was nearly a coin flip at 50.6.
Gig Harbor is the odd entry on that list. It is generally low density and car oriented, and it still voted 58.5 percent yes. This might be attributed to how Pierce Transit is seeking to double frequency on routes serving Gig Harbor and its connection to Tacoma as well as investing in seasonal waterfront “trolley” service.
94 precincts landed between 40 and 50 percent yes, and 123 landed between 50 and 60. That is 217 precincts, more than half of the ballot area, sitting within ten points on either side of approval.
East Pierce County went the other direction. Puyallup, Milton and Edgewood all voted no, but not by significant margins. Unincorporated Pierce County, which casts the second largest bloc of ballots in the district after Tacoma, voted 48.9 percent yes.
Concentrations of no votes were found in areas without fixed route Pierce Transit service.
| Municipality | Yes | No | Yes % |
|---|---|---|---|
| Pacific | 5 | 1 | 83.3 |
| Tacoma | 49,534 | 25,963 | 65.6 |
| Ruston | 312 | 175 | 64.1 |
| Fircrest | 1,769 | 1,168 | 60.2 |
| Gig Harbor | 3,709 | 2,632 | 58.5 |
| University Place | 7,347 | 5,230 | 58.4 |
| Lakewood | 8,665 | 6,333 | 57.8 |
| Fife | 1,116 | 856 | 56.6 |
| Steilacoom | 1,504 | 1,242 | 54.8 |
| Auburn | 1,602 | 1,567 | 50.6 |
| Unincorporated Pierce County | 18,388 | 19,252 | 48.9 |
| Puyallup | 6,725 | 7,243 | 48.1 |
| Milton | 1,086 | 1,207 | 47.4 |
| Edgewood | 2,162 | 2,935 | 42.4 |
| Total | 103,924 | 75,804 | 57.8 |
Results at the precinct level
Of the 423 precincts in the ballot area, 290 precincts voted yes, 117 voted no, and 3 split exactly evenly. The median precinct came in at 57.0 percent yes, within a point of the countywide result. A measure carried by a few dense neighborhoods would show a median well below its average. This was a victory for transit that had a broad base of support.
Of the 15 precincts above 80 percent yes, 13 are in Tacoma, plus one each in Pacific and Milton. The 23 precincts below 40 percent yes are mostly in unincorporated Pierce County and in parts of the City of Puyallup.
The strongest precincts also carried some real volume. The largest vote difference was in precinct 27-423, in Tacoma’s North End, which cast 797 yes votes at 77 percent approval.
How cities changed their vote since 2012
This is not the first time Pierce Transit has run a measure like this. The previous attempt, in 2012, lost narrowly. Fourteen years later the same question has now won by almost eight points.
| Municipality | 2012 yes % | 2026 yes % | Change |
|---|---|---|---|
| Ruston | 51.6 | 64.1 | +12.5 |
| Tacoma | 55.0 | 65.6 | +10.6 |
| Lakewood | 48.1 | 57.8 | +9.7 |
| Fife | 47.1 | 56.6 | +9.5 |
| University Place | 49.4 | 58.4 | +9.0 |
| Gig Harbor | 50.5 | 58.5 | +8.0 |
| Fircrest | 52.7 | 60.2 | +7.5 |
| Auburn | 44.7 | 50.6 | +5.9 |
| Unincorporated Pierce County | 45.5 | 48.9 | +3.4 |
| Puyallup | 45.0 | 48.1 | +3.1 |
| Milton | 44.4 | 47.4 | +3.0 |
| Edgewood | 40.0 | 42.4 | +2.4 |
| Steilacoom | 52.5 | 54.8 | +2.3 |
Two patterns in how the cities evolved stand out.
First, the places that liked transit in 2012 still liked it in 2026 and the places that were less transit-supportive remained so. The geography did not fundamentally realign.
Secondly, the margin between the strongest and weakest municipality widened from 15 points to 23. Tacoma gained 10.6 points. Edgewood gained 2.4. Lakewood, Fife and University Place all gained nine or more, while Edgewood, Milton, Puyallup and unincorporated Pierce County gained between two and three and a half.
What I think it means
Several factors came in to play to influence the outcome of this ballot measure, including: better campaigning, lack of an organized opposition campaign, momentum from a progressive electorate nationally, record high gasoline prices, as well as changes to the population in 14 years.
The Keep Pierce Moving campaign was effective at advocating for this measure and it shows in the lack of undervotes where the campaign put its energy. Thanks should go to Tacoma on The Go, Transportation Choices Coalition, the staff organizers, voluteers and their financial contributors. This campaign brought together resources, a coherent message, and a diverse set of organizations to support passage. Unlike in previous propositions, organizations that may have opposed increased transit funding in the past, such as the Tacoma Pierce County Chamber of Commerce, were brought alongside longtime supporters of expanded transit service, such as the Pierce County Central Labor Council, Disability Rights Washington, Futurewise, Sierra Club, and Pierce County Democrats.
The measure was also easy to explain. More buses on the routes people already ride is a concrete promise. A rider on Pacific Avenue can picture a bus every fifteen minutes. A rider in unincorporated Pierce County might struggle seeing a route that doesn’t already exist.
The lack of an organized no campaign may have contributed substantially to undervotes in unincorporated Pierce County, where there was less engagement.
28.6% of unincorporated ballots were left incomplete on the issue of Pierce Transit Proposition 1 in comparison with a 9.7% undervote rate in the county overall.
By contrast, fewer than one in 25 Tacoma voters who cast a ballot, did not cast a vote either way on Proposition 1. This shows that transit is a winning issue in Tacoma when voters are informed and asked about supporting it.
A note on the numbers
These are from the VoteWA results export for the November 3, 2026 general election, and they are unofficial. Later ballots and cured ballots will move them, usually by a few tenths of a point before the results are fully certified.